
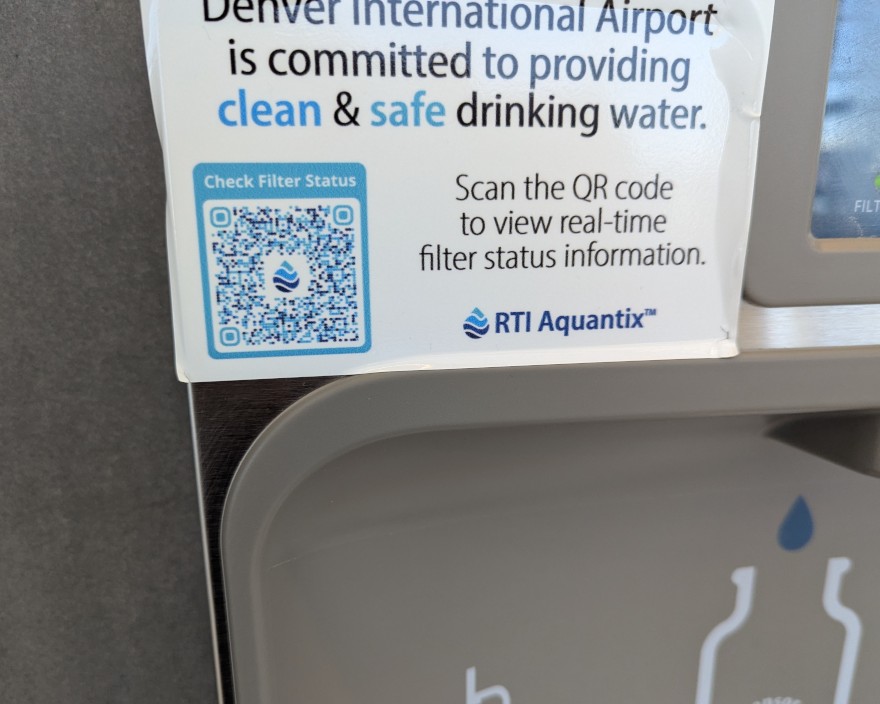
While I was traveling home from my team's last in-person get-together, I noticed that the drinking fountains across from gate B69 in the Denver airport had QR codes on them. (The QR codes in the pictures are clickable. I've always wanted to use an HTML image map!)
When you scan the codes, they take you to a dashboard that shows how many gallons of water have passed through the fountain's filter each hour. It retrieves its data from a public GraphQL endpoint. It would take less than a hundred lines of throwaway code to rig up another client and glue it to a charting library.
The next morning, the jet lag woke me up early, so I did that. It seemed like a good idea at the time:
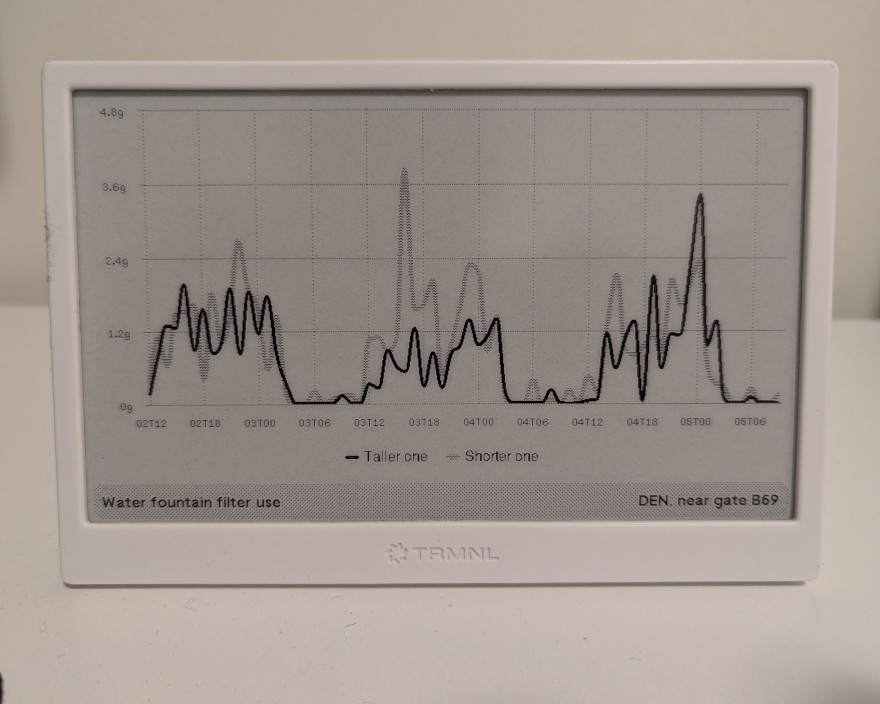
Several months later, that chart is still in the device's slideshow. Every once in a while when I walk through the living room I have occasion to smile at seeing live telemetry from a specific bank of water fountains located two states away. I still don't know what to make of the fact that this data is publicly available.
2026-09-03
↑ Home
← Ligatures as a polyfill for prettify-symbols-mode, and my prettify-symbols-alist for web development